![]()
Page History
...
Overview
...
| Section | ||||||||||||||||||||||||||||||||
|---|---|---|---|---|---|---|---|---|---|---|---|---|---|---|---|---|---|---|---|---|---|---|---|---|---|---|---|---|---|---|---|---|
|


...
UI Paths
...
||V-Ray Asset Editor|| > Create Asset > Render Elements > (right-click) > Lighting Analysis
||V-Ray Asset Editor|| > Render Elements (right Create Asset (left-click) > Render Elements > Lighting Analysis
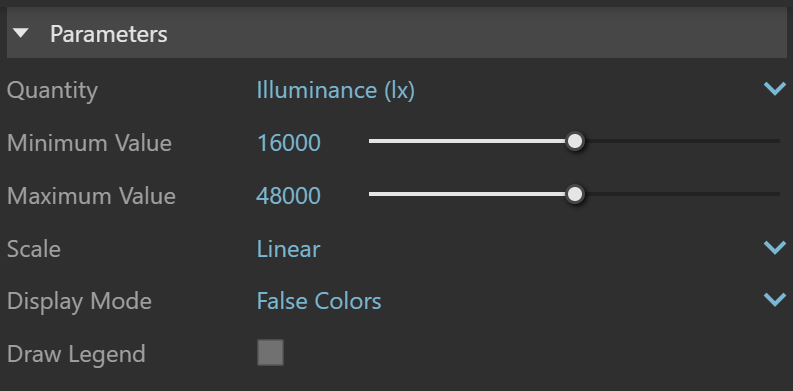
Parameters
...
| Section | |||||||||||||||
|---|---|---|---|---|---|---|---|---|---|---|---|---|---|---|---|
|
...
Examples: Lighting Analysis
| Section | |||||||||||||||||||||||||||||||||||
|---|---|---|---|---|---|---|---|---|---|---|---|---|---|---|---|---|---|---|---|---|---|---|---|---|---|---|---|---|---|---|---|---|---|---|---|
|


Notes
...