The Light Analysis Render Element provides a visual representation of the lighting intensity in the rendered frame. It maps Illuminance and Luminance information as color gradient or a grid of measured values onto the frame.
The Illuminance and Luminance channels are internally created during rendering.
During the rendering, the Lighting Analysis might display some approximation to the false-color image, but that is not the final result. After the rendering is finished, every parameter change made in the Asset Editor automatically updates the render result in the VFB.
V-Ray for Grasshopper offers a Lighting Analysis Element component. To see more information, see the V-Ray Element Lighting Analysis page.
Column
width
5%
Column
width
45%35%
Before after
afterLabel
GRID
beforeLabel
RGB
Panel
borderStyle
none
Panel
borderStyle
none
...
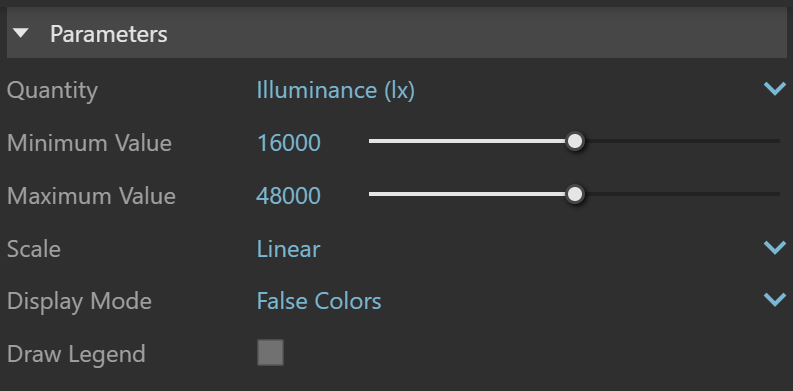
Parameters
...
Section
Column
width
50%60%
Quantity – Chooses which lighting information to be analysedanalyzed.
Illuminance (lx) – Uses the Illuminance of the rendered frame in lux. Luminance (cd) – Uses the Luminance of the rendered frame in candelas.
Minimum Value – Specifies which values are mapped to blue.
Maximum Value – Specifies which values are mapped to red.
Scale –Specifies how values are mapped to colors onto the frame.
Linear – The colors are mapped in linear scale. Logarithmic – The colors are mapped in logarithmic scale.
Display Mode –Specifies the analysed analyzed data display mode.
False colors – Fills the frame with a gradient ranging from blue (low values) to red (high values). For the out of range values,it uses respectively black and white. Grid overlay – Displays the values at distinct grid points over the frame. They use the same grading colors.
Draw Legend – When enabled, shows a legend of the false colors at the bottom of the render.